Oh my! A new type of equation! Yep, it is time to learn a totally new equation! This one is the 'quadratic' equation. Quadratic equations do not form a straight line (makes sense…we have linear equations for those). Quadratics form something called a parabola which is a curvy line. Think of the letter U…that's a parabola. |
||
The form for writing a quadratic equation looks like this:
The x will indicate how 'wide' (think spaced out) or 'narrow' the parabola will be. If x is a big number, the parabola will be very narrow. Hence, if your x is a fraction, you are going to have a widely-spaced looking parabola. How will you know if the parabola will open up or down?
Here is a great way to help you remember! Check it out. |
||
 |
||||
 |
||||
Positive ax2 is a HAPPY face. The parabola opens UP. |
Negative -ax2 is a SAD face. The parabola opens DOWN. |
|||
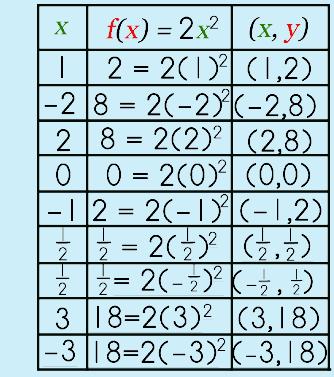
A table of values can be a useful tool when working with quadratic functions. It can help you when you want to plot points on a grid. Here is an example. Let's say you have an equation, y = 2x2. Sometimes this may be represented as f(x) = 2x2 You want to know what the graph of the equation looks like. The best thing to do is to make a table of values. The table would look like this: (You simply put in your own values for the x) |
||
 |
||||||||||
The first column is the values you want for x (the domain). You can choose your own values here.
The second column is the equation. Simply subsitute whatever value you have for the x into the equation. Here you get your range (y).
The third column combines your x and y together into an ordered pair (x,y). This is what you are going to graph onto your Cartesian plane (coordinate grid). |
||||||||||
 |
||||||||||
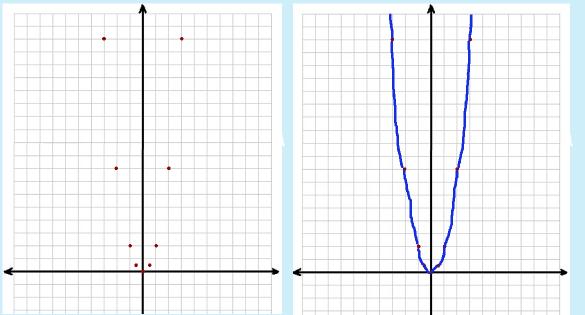
So, what does a quadratic function look like when it is actually graphed? In the first picture, the points have been plotted. In the second picture, the points have been connected. Because this is NOT a linear graph, you cannot use line segments. A parabola is a curvy graph so you can't use your ruler to connect the points! When you connect-the-points, simply connect them one at a time, making sort of a curvy line. |
||||||||||
 |
||||||
 |
||||||
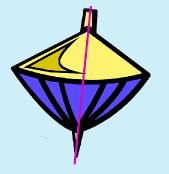
One of the key points (no pun intended!) of a parabola is the vertex or the point where the curve flips and becomes symmetrical. This point (an ordered pair) is called the vertex and is also known as the axis of symmetry. It is the axis of symmetry because it is at this point that the parabola can be cut in half and can be basically rotated about that point so that it is symmetrical! If you think of a whirligig (spinning top), then the pointy part where at the bottom where it spins would be the vertex or the axis of symmetry. If you were able to hold the top and imagined a line (shown in pink), you can see that the whirligig is spinning on an imaginary axis.. |
||||||
So, how do you find the vertex or axis of symmetry when you have a quadratic function? It is actually all computational! Let's see how it is done. |
||
Here's a problem: |
||||
Finding the Vertex or Axis of Symmetry Step 1: Make a fraction from the coefficients a and b
|
||||||||
Step 2: Multiply your fraction by -1/2
|
||||||||||||
 |
||||
Step 3: Go back and substitute this x value into your original equation.
|
||||
How can you tell, by LOOKING at a quadratic function, if the vertex is going to be considered 'minimum' or 'maximum' and what exactly is the difference between the two vocabulary words? Well, if you stop and thought about the two words, you just might be able to come up with a logical conclusion. Since a parabola is a U-shape, let's take a look at what this shape looks like in a drawing again and see if you can come up with a conclusion all on your own. Okay, now think of the two words: minimum and maximum. What do they mean? Which of the two parabolas do you think just might indicate minimum and which just might indicate maximum? If you think of a mountain or a valley, which words might fit minimum and maximum? Can you put the two words together now with the parabolas? Did you come up with the first one shows minimum and the second shows maximum? If you did, then you got it right! Yahoo! What part of the equation will help you determine if the equation will show a minimum vs. maximum vertex? Did you say the 'a' coefficient? Hooray! If the a coefficient is positive, you will end up with a maximum vertex. If the a coefficient is negative, you will end up with a minimum vertex. PS: Where have you see this information before? |
|||||||||||||
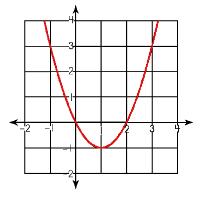 |
|||||||||||||
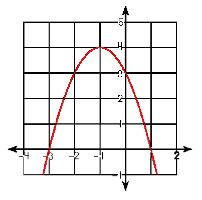 |
|||||||||||||
Look at the equations. How do you think you can tell if the equation is going to show the equation will have a minimum or maximum vertex? |
|||||||||||||
WAIT! Is there ANY other way to find out this information? I just think this is way too hard for me… Yes, there is! Personally, I think the Standard Form may be a bit easier. It is simply another way to find the vertex from the quadratic function and also is a faster, maybe even easier, way to determine if the parabola will open up/down and have a minimum/maximum vertex. If you are game to try a new method, then check it out! |
||
©2011–2014 Sherry Skipper Spurgeon. All Rights Reserved. |
||
©2011–2017 Sherry Skipper Spurgeon. All Rights Reserved. |
||