 |
||
 |
||||
Thanks to René Descartes, the French philosopher and mathematician, who supposedly was lying in bed and staring up at a fly on his ceiling, we have a fabulous way to graph equations. We now have what is known as the Cartesian Plane! We can use an ordered pair of coordinates to specify a point to indicate a specific orientation or location in space. |
||||
Before you can do anything, you need to know the basics. Understanding the basics is key as this will be your foundation. |
||
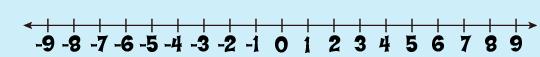
Number Line: A number line has arrows at both ends which means it goes on indefinitely. |
||
 |
||||||
 |
||||||
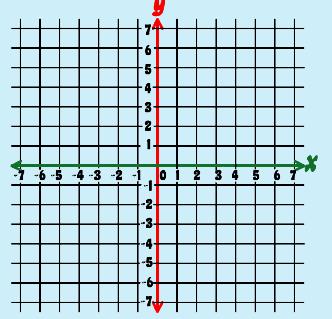
x-axis and y-axis: two number lines, one goes horizontally (x-axis) and the other vertically (y-axis). The x- and y-axes give you dimensionality, so points can be plotted in a plane. When plotting points, you move across the x-axis first then, you move up or down along the y-axis.
|
||||||
 |
||||
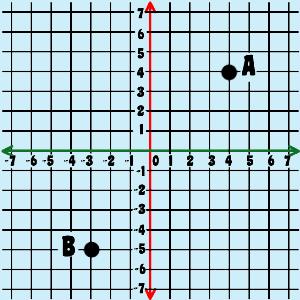
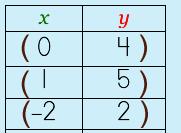
coordinate pair (or ordered pair): how to describe a point's location on the Cartesian grid by the point of intersection on the x-axis and y-axis; (x, y) abscissa: the value of the x in the ordered pair (x, y) ordinate: the value of the y in the ordered pair (x, y)
|
||||
 |
||||||
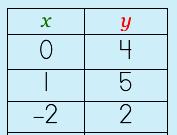
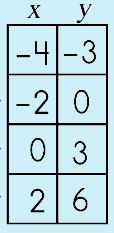
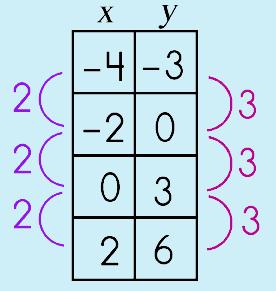
function: a table of ordered pairs that shows the relation between the domain (x values) and the range (y values) and how they correspond to one another.
|
||||||
 |
||||||
 |
||||
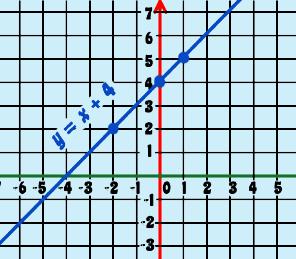
graphing the function: plotting the points of the function on a Cartesian plane/grid All the points on the 'graph' are the solutions to the equation. This is the awesome part of graphing linear functions.
|
||||
There are three different 'forms' of linear equations. You should be familiar with all three because you will be working with problems in all of the forms.
|
||
|
|||||||||||||||||||||||||||||||
|
||
|
|||||||||||||||||||||||||
|
||
|
||||||||||||||||||||||||||||||||||||||||||
|
|||||||||||||||||||||||||||||||||||||||||||||||||||||||||||||||||||||||||||||||||||||||||||||||||||||||||||||||||||||||||||||||||||||||||||||||||||||||||||||||||||||||||||||||||||||||||||||||||||||||||||||||||||||||||||||||||||||||

|
|||||||||||||||||||||||||||||||||||||||||||||||||||||||||||||||||||||||||||||||||||||||||||||||||||||||||||||||||||||||||||||||||||||||||||||||||||||||||||||||||||||||||||||||||||||||||||||||||||||||||||||||||||||||||||||||||||||||||||||||||||||||||||

©2011–2017 Sherry Skipper Spurgeon. All Rights Reserved. |
||